On the Ninth Day of Partnerships, Integrations, and Other Good Things, Shortcut brings to you: Google Sheets. This spreadsheet program is cool enough to get at least nine ladies up and dancing. For these spreadsheet lovers, today’s integration has (half of) their names written all over it. Because it’s just called Sheets. Sheets is the fresher, younger, hipper sibling to spreadsheets.
For the spreadsheet enemies and haters: maybe now is the time, with this integration, that you’ll learn to actually love breaking down populated data in fields, who knows?
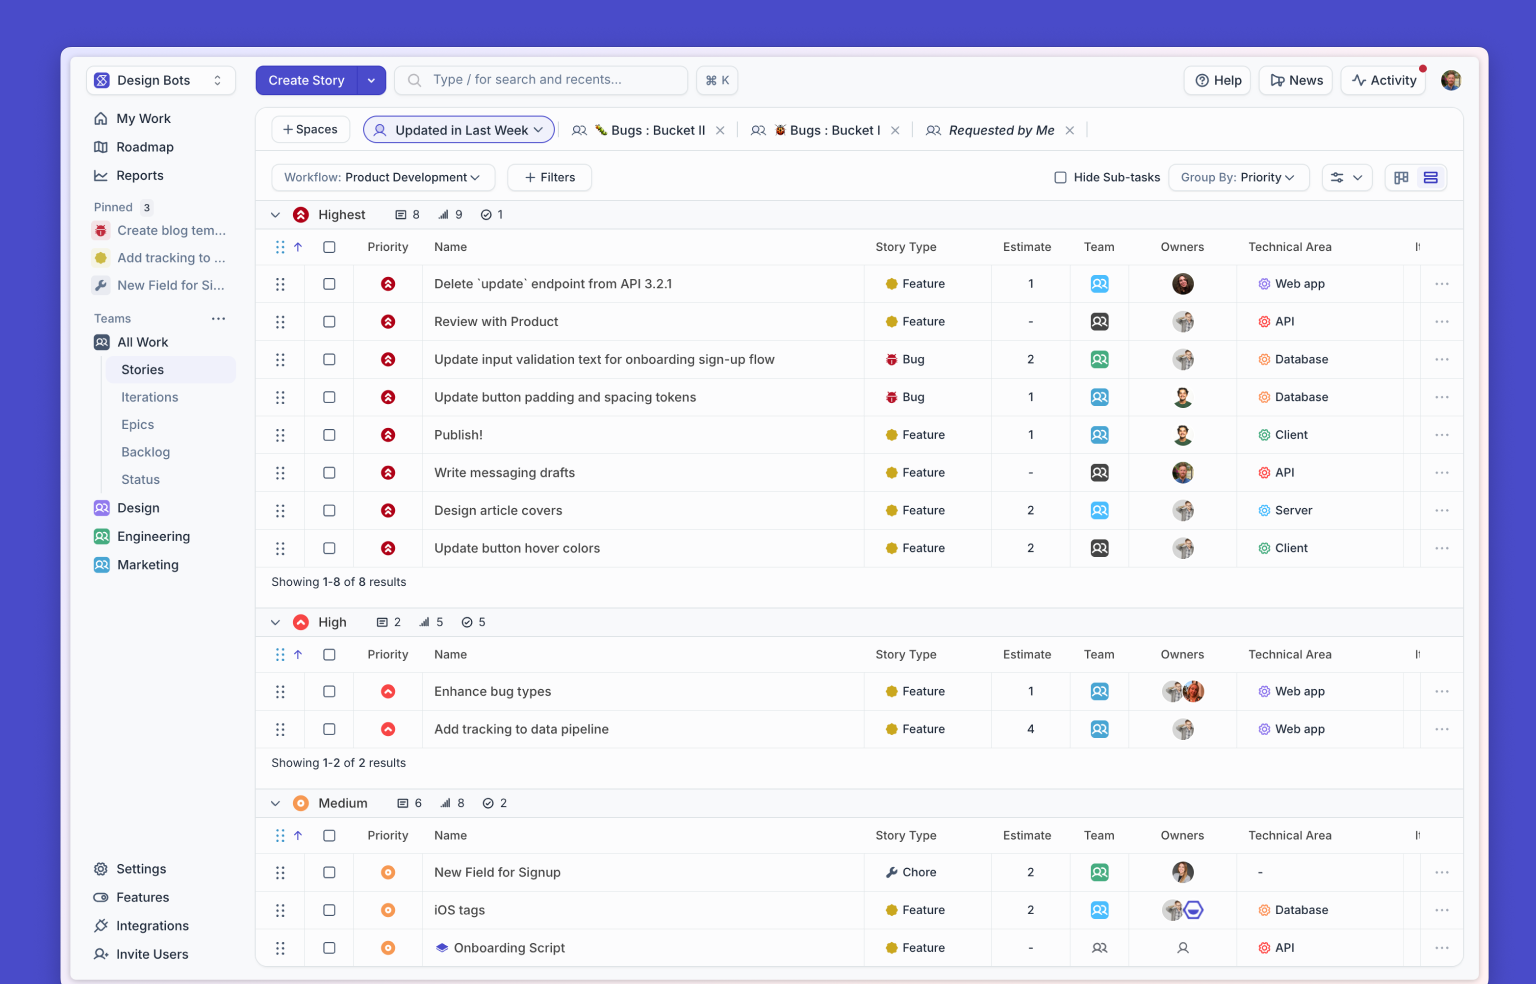
The beauty of the Shortcut + Google Sheets integration is that you can get real-time updates of Shortcut data to be sent to a connected Google Sheet. So, any updates that happen in your Shortcut Workspace will be dynamically updated to this connected Google Sheet. The data sent from Shortcut to Google is the same data that's captured from your Workspace when you export to CSV.
What about the functionality? Here you go👇
Create custom charts and dashboards in Google Sheets
Once your Shortcut Story data is loaded into Google Sheets, you can use trusty Pivot Tables, logic, formulas, macros, and more to create charts and even custom dashboards. The world is truly yours to own, because here’s what you can build:
- A chart of Bugs w/ Priority Level: Create a chart based on Story Type Bug. If you use Labels to assign Priority, you can then create a stacked bar chart to represent the different priorities.
- Time-based charts: Use a formula to calculate start and end dates to see how work is progressing. Combined charts (bar and line) can help identify bottlenecks or opportunities for improvement.
- Performance Charts: Use a formula to calculates total Story points to represent the complexity of ongoing work compared to the time it takes to complete that work and create a score for it.
- Dashboards by Team: Organize your data by your Workflows or Project and build charts sliced by that data. Then add a dropdown menu in Google Sheets for the different Teams to access these various dashboards.
Have a field day accessing these fields in your data
Epic fields:
- Epic State (epic_state)
- Epic is_archived (epic_is_archived)
- Epic Start Date (epic_started_at)
- Epic Due Date (epic_due_date)
- Epic Created Date (epic_created_at)
Milestone fields:
- Milestone ID (milestone_id)
- Milestone Name (milestone)
- Milestone State (milestone_state)
- Milestone Start Date (milestone_started_at)
- Milestone Due Date (milestone_due_date)
- Milestone Created Date (milestone_created_at)
Visualize your Shortcut data in Google Sheets
- Connect to a BI Tool: Your Google Sheet export can also be linked to any BI tool that ingests Google Sheets, allowing you to pull your data into your preferred tool of choice.
- Uncover gaps in the data: Building charts and playing with the data makes it easier to uncover additional questions (and additional answers), alongside new points to track and analyze. For example, maybe you're using different types of Labels to categorize your Stories. When these Labels also add a layer in Google Sheets that you can then use to further customize your reports and charts. Or maybe you notice that your team needs to do a better job of closing Stories out once they're completed so that you can more accurately track how long work is taking to complete.
Enable the Google Sheets Integration
First, have your account Admin or Owner navigate to the Workspace Features > Shortcut Labs > and then toggle on the Google Sheets Integration. Then have an account Admin or Owner navigate to Select Integrations > Select Google Sheets > Authorize with Google. That’s it!
With automatic updates, let the Integration do the heavy lifting
Once connected, we'll create a new Google Sheet with a live connection to your Shortcut data. Each row will contain rich Story data and new changes will override existing info in real-time. The sheet is private to you, but you can share it with a wider audience as you see fit.
Connecting your data to Sheets enables you to build custom charts, reports, and dashboards to drive insights into what's going well (and not well, so you can fix it!). It's also great for sharing progress with the leadership team.
Check out this article in the Help Center for a more thorough guide to setting up this integration. Also, take a look at this presentation by Guru’s Matt Sheaffer from April to see how his team used the Google Sheets Integration to build out an internal Customer Pain Score and dashboard. Now, it’s time for the ladies to dance, maybe even three Sheets to the wind, because it’s the holiday season.

%20(788%20x%20492%20px)%20(1).png)
.png)