If you’re not tracking lead time, you probably aren’t as agile as you think. But, then again, there are a mind-numbing number of metrics to track, and just about everyone will tell you a different one is the most important and if your aren’t doing that one you aren’t as agile as you think.
Which is why we’re not here to tell you that there’s One True Agile Metric you need to focus on above all else. Rather, each metric is an important piece of the puzzle that is your production pipeline. If you’re not tracking lead time, there might just be a hole in the big picture of your development process.
What is lead time, and why is it a Big Deal?
Lead time is the measurement of how much time passes between task creation and when the work is completed.
If you’re focused on cycle time alone—that is, the time between when your team starts work on a feature and when it goes to the end users—you’re seeing only a piece of the agile puzzle.

Put another way, lead time is a “user point of view” measurement, or how long it takes, from the perspective of the user, for a feature to go from “requested” to “complete.” In contrast, cycle time is a “developer point of view” metric that measures the time between when a programmer starts work and when it’s delivered. Think of it as if you’re ordering a pizza: the clock starts on lead time when you place your order, and it stops when the pizza shows up on your doorstep. But cycle time measures only the time from when the cook starts your order to when it’s in your hands.
So why is it bad to track only the cook time (cycle time) of your pizza instead of the whole order pipeline (lead time)? Because, if there’s an issue between the time you place your order and when the dough gets thrown, you’ll either get your pizza late or not at all (which would be an actual tragedy). And these issues will screw up your experience no matter how agile the pizza’s cooks (developers) are when they’re slinging the dough (code). We could stay in this paragraph making pizza / software development analogies all day, but should probably move on.
A number of issues could have caused this: The pizza shop’s online ordering could be down, the teenager taking your order via phone could have gotten distracted by a message from [INSERT WHATEVER SERVICE TEENAGERS CURRENTLY FIND COOL ON THE DAY YOU’RE READING THIS], or your order may have been lost during the lunch rush. If the pizzeria owner — or you, in the case of your own non-pizza-related endeavors — don’t track lead time, they don’t have visibility into what’s holding up the process and frustrating customers, and they’ll undermine all the hard, efficient work of their cooks in the process.
Put back into less-greasy terms: Your tasks could be stalling out in your backlog, sitting too long in your queue, or failing to be approved and prioritized appropriately. These constraints can delay the development of key features or bug fixes, balloon your budget, and create friction in your otherwise-agile workflows. Additionally, long lead times force your customers to wait longer for the functionality they need.
But you’ll never know if you’re not tracking lead time.
Lead time helps you understand if you’re actually agile
Lead time reveals if you’re practicing agile overall, or if you’ve just used the methodology when building your code.
You want to unblock a development pipeline that involves going from A to B to C. Before agile, there were blockages at every stage. You need to remove all the crap that’s getting in your way throughout the full pipeline, but cycle time only shows you what’s holding things up between B and C. You're still blocked between A and B — you’re just overlooking it because you're not zoomed out enough.
Measuring lead time fixes this by zooming out your view—and your understanding—of your development pipeline to reveal what blockages are canceling out all the agile work done by your developers.
Typically, working agile means that you have adopted a framework like Scrum and use it to break your work into sprints, which are carefully mapped and carried out with sprint planning, stand-ups, reviews, and retrospectives.
The insight gleaned from lead time is especially valuable if your cycle times are low—that is, your developers are working quickly and agilely—but you’re still running into issues, such as users waiting too long for key features to be deployed.
To begin measuring lead time, you should map out your value stream to identify the specific areas of development that hold you up. If you’re a small team that gets a bunch of requests from users, your constraint may be scheduling (which takes place before the clock starts on cycle time). Or, if you’re used to urgent change requests bumping back less-pressing changes, your constraint could be backlog management. Creating a value stream map could help you identify your constraint, and then measuring lead time will let you see how you’re doing at alleviating that constraint.
By driving down your overall lead time and efficiently managing work throughout your development pipeline, you can help ensure that you’re agile overall, not just when you’re building your code.
Lead time can help optimize your development pipeline
Lead time gives you data to create benchmarks on how long it takes for your work to go from start to finish.
Using your lead-time data, you can see what stages of development take the longest, or where work is falling through the cracks. This information will show you where you need to improve your process and identify what chronic problems plague your development pipeline. Then, based on these insights, you can experiment with changes such as adding more resources or breaking up work to drive down lead time in the future.
Your lead time should fit your sprint schedule of one to four weeks if you’re working within Scrum. When your lead times consistently fail to meet your sprint schedules, there’s an issue to be uncovered.
There are a number of issues that can cause high lead times, but some of the most common include:
- Inefficiencies in backlog management: When new tasks come in, they’re often relegated to a team’s backlog. Without a clearly defined and measured process for handling how work is released from this queue, requests can be relegated to the sideline.
- Delays with hand offs and manual procedures: Organizational silos can cause high lead times because everyone is relying on their own systems of batch-based approvals. (Consider using Epics in Shortcut to bring all teams together towards a larger initiative.)
- Holdups during approval: While the approvals process originally served to reduce risk and provide quality assurance, the extra work involved in getting sign-off for each new feature slows down lead time.
- Issues with environment management and provisioning: If your software developers are left waiting for environments you’ll see lead times rise and negatively impact release schedules.
- Manual software deployments: Where else could you potentially automate your processes?
- Manual software testing: Manually testing your code base is a slow process no matter your project size.
A delay at any one of those stages will balloon your project down the road. Tracking lead time will help you understand which touchpoints cause the most friction, and why.
Take prioritizing and managing your backlog, for instance. You add a feature request to the backlog when users request a feature or when your team realizes a new feature/functionality is needed. But, depending on the urgency of the change request and the tasks that come in around the same time, work can sit for days, weeks, or months in your backlog.
If, as part of your lead time measurement, you notice if your backlog grows over time, despite consistent work by developers, you may have a capacity issue.
When you measure lead time, you can keep tabs on your queue and keep things moving forward without the risk of neglected or forgotten tasks.
Read More: Use Product Analytics to Improve User Exerpeience
Lead time will reveal, help you understand outliers
You’ll not only gain insight into how your tasks evolve from start to finish when you measure lead time, but you’ll discover the exceptions to these rules, too. This is because lead time paints a complete picture of not only what stages each task has to go through before being worked on and deployed but also what features or task types may stand out from the rest.
In a perfect world, you’d be able to predict every request from your end users before they happened, creating the perfect product on the first try. But we don’t live in a perfect world, and end-user requests are caused by all kinds of different experiences. Often, users request similar changes, but not always.
.gif)
You can begin to create a better picture for what kinds of user stories need to be treated differently than the others when you have a full understanding of what tasks take longer than others to move from backlog to production. Then, based on this information, you can flag the tasks you know need special treatment up front to avoid unnecessary delays on the downstream production pipeline.
The data you gather around your outliers will reveal where your team should focus more of their energy and will help you understand what kinds of requests may just be one-offs.
Use lead time and other agile metrics to get the whole picture
Lead time is an important metric to understand and track to ensure that you’re doing something with all the good ideas from your teams and users, but it’s not the be all and end all of agile metric tracking. Combine lead time with cycle time to get a high-level, complete view of your production pipeline.
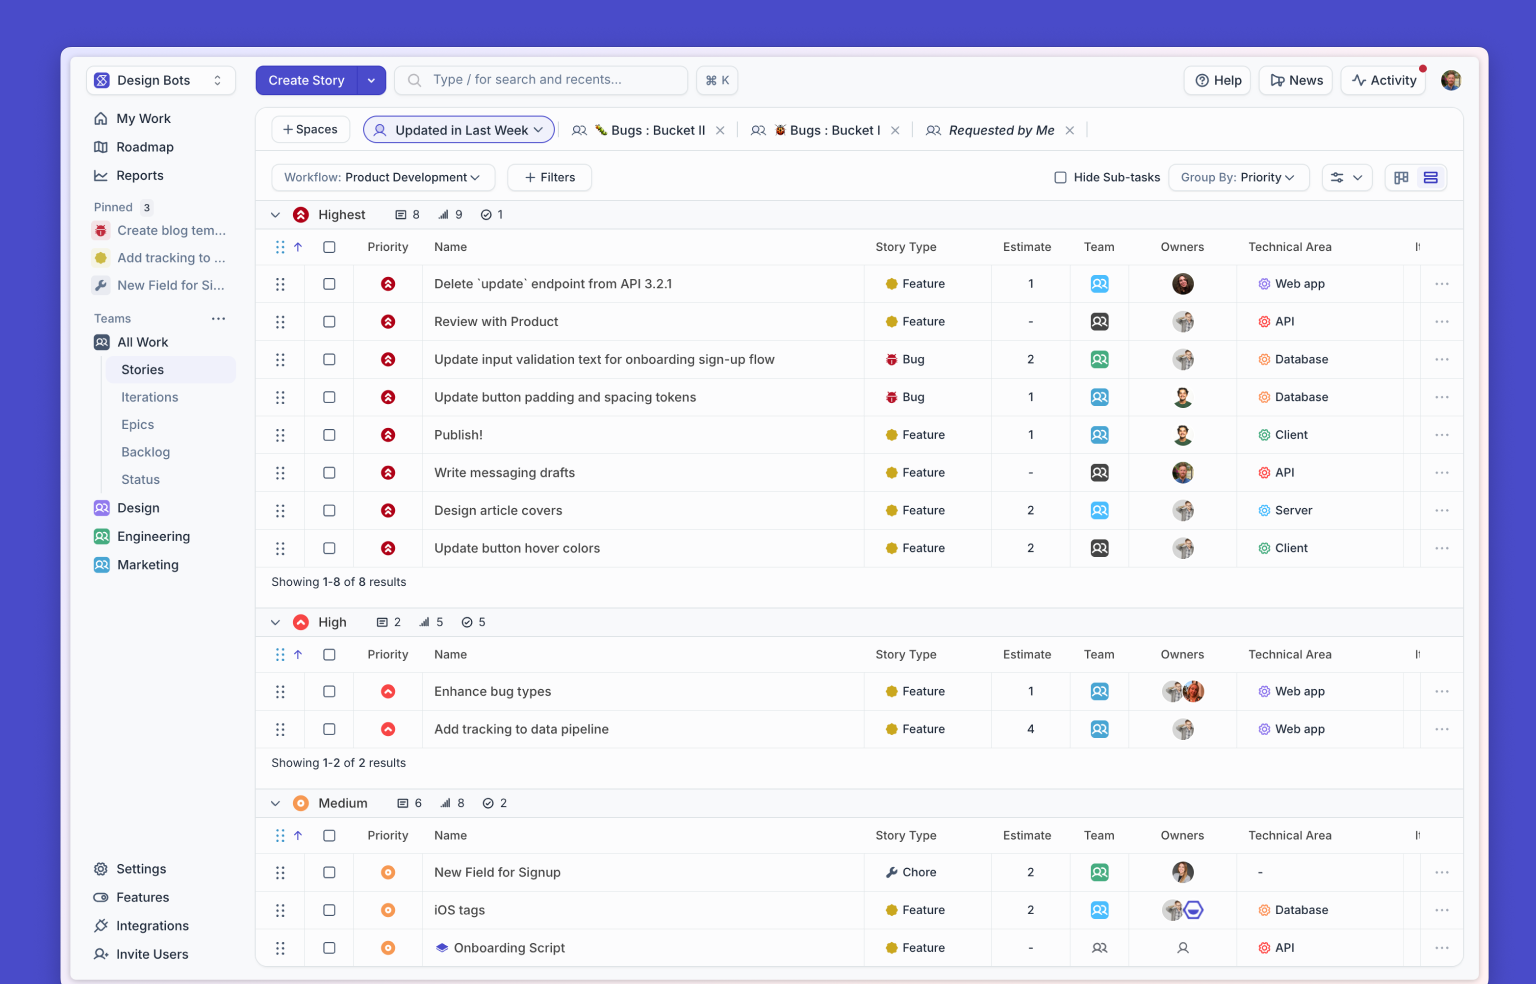
To make it easier to understand how these metrics impact your project development, look at Cycle Time and Lead Time Reports in Shortcut to gain visibility into your performance and progress.
Read More: How to Build Trust Through Reporting
Cycle Time and Lead Time Charts in Shortcut
Cycle Time Chart (the total time between when a Story was started and when it was completed)
- Work Completion Predictions: Cycle times allow you to look at similar projects and provide data-driven predictions on the time it will take to complete similar projects. Lower cycle times mean you can better predict what work you can achieve. Basically, the less time it takes to do work, the better accuracy you have in that prediction.
- Unstable Cycle Times: Chaotic or unstable cycle times can mean that team processes are not well established. This creates a good opportunity for discussion. On the other side, a stable cycle time indicates a team is working at a sustainable pace, and not encountering too many disruptions.
- Custom: You have the option to view this chart in Type: Custom which allows you to select a specific workflow and the workflow states you would like include (or excluded). This is helpful for a custom workflow to ensure the data includes the correct stages.
Lead Time Chart (the time between when a Story was created and when it was completed)
- Entity Pages: This chart can be interesting to view on the Milestone or Epic page as it tells you how long Stories take to be completed for those specific initiatives.
- Backlog Considerations: Depending on how you manage your backlog this chart can end up being more or less impactful. A common way to manage backlog in Shortcut is through a “Backlog” workflow state, which depending on your team and process could mean the lead time is really long, and that’s okay!
Cycle Time/Lead Time Chart Best Practices
- Maintain Story Hygiene: The more defined your process is for moving Stories to completed, the more accurate your data will be. For cycle time, it's important to only move work to in-progress when it's actually ready (and move it back to unstarted if needed).
- Filter on the Reports Page: Use these filters to drill into more targeted Cycle Time & Lead Time reporting around Dates, Teams, Story types, and more.
- Note the Trailing Average: This will be the most insightful if you look at longer time periods.
- Calculate how long Stories sit in an Unstarted State: Subtract Lead Time from Cycle Time.
Start Your Free Shortcut Trial
At Shortcut, we use Shortcut for task management and to track workflows. We use it to collaborate on work with our software engineers, design squad, marketing squad - every team member and stakeholder. It’s where we keep our product Roadmap and track our Epics, Stories, Milestones, and sprints.
Read More: The Shortcut Way
With kanban boards, reporting, and much more, it’s the only powerful project management tool without all the management for product management teams and development teams - more powerful than Asana, much easier usability than Jira ( 👎), and with many more features than Trello.
As long as you have a product to sell, make everyone’s life a little easier with Shortcut. Get started with your free trial.

%20(788%20x%20492%20px)%20(1).png)
.png)