Cycle Time Reports provide your team with the data you need to plan and allocate resources more effectively.
Cycle Time is the total time between when a Story was started and when it was completed. The Cycle Time Chart represents how long it takes a Story to be completed after it is Started. This can provide insights such as: “On average it takes us X amount of days to complete certain types of Stories” or surface outlier Stories.
The chart is available on the Reports page and on entity pages for Epics, Objectives, and Iterations. You can also view Lead Time (time from Story creation to completion) via the upper right-hand corner drop-down. A Custom chart type lets you select the Start and End states used in the calculation for a specific workflow.
Adjust States used in Calculations
Once you’ve selected the Custom Chart Type, you can modify which states are included in the calculations. This is useful if you have workflow states that should (or shouldn’t) be included in calculating Cycle time. When adjusting the workflow states, they must be continuous; you cannot exclude a Workflow state in between your selected Start and End state.
Chart Axes
The Y-axis of the chart represents the number of days.
The X-axis represents the completion dates of the Stories in the selected date range, Epic, Objective, Iteration or Project in which you are viewing Cycle Time reports.
Report Stats

The chart provides an average Cycle Time and Lead Time as well as Minimum time. The average is also represented in the chart as the dashed line across the chart:

Trailing Average and Story Type Filter
A 7-day trailing average is also included in the chart. The trailing average does not calculate the average over the last 7 consecutive days, rather the last 7 days of available data.
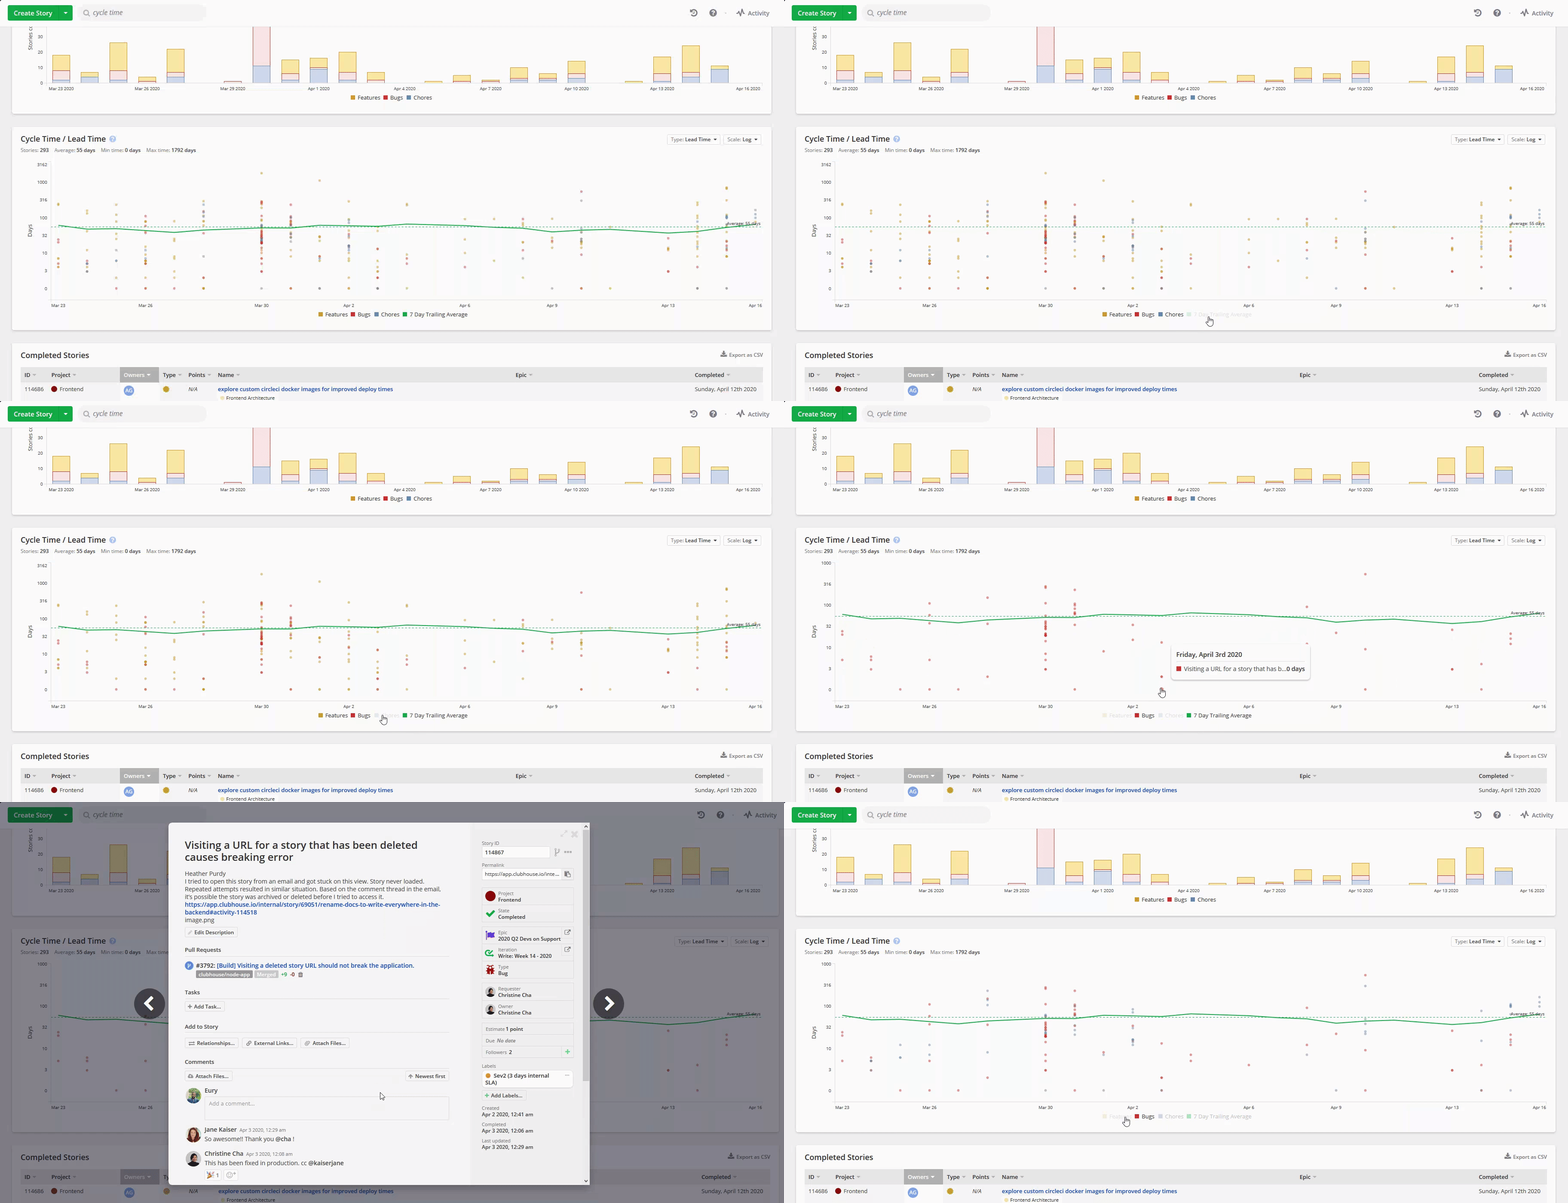
Stories within the chart are represented by colored dots. Clicking on a dot will open the selected Story. Each Cycle Time chart can also be filtered by Story Type (Bug, Feature & Chore) as well as a 7 day trailing average.
Using the Cycle Time Chart
- Work Completion Predictions - Cycle times allow you to look at similar projects and provide data-driven predictions on completion time. Lower cycle times mean better prediction accuracy
- Unstable cycle times - Chaotic or unstable cycle times can mean team processes are not well established, creating a good opportunity for discussion. Stable cycle time indicates a team working at a sustainable pace
- Maintain Story Hygiene - Only move work to in-progress when it’s actually ready (and move it back to unstarted if needed)
- Note the Trailing Average - Most insightful when looking at longer time periods